In IBM Data Science Capstone Project, we have to import Neighbourhoods Postal Codes of Toronto in order to fetch information using Foursquare API. We can obtain geojson file of Toronto Open Data but the geojson file is actually divided by Neighbourhood division, not on its postal codes. We have to customize our geojson file, using shape file from Statistics Canada.
Table of contents
1. Preparation
1.1 Data Sources
- List of Postal code of Toronto: This wikipedia page is for obtain all the neighbourhoods, including postal code, borough in Toronto.
- Boundary file: You can download the shape file from https://www12.statcan.gc.ca/census-recensement/2011/geo/bound-limit/bound-limit-2016-eng.cfm. Please note the 2016 Census - Boundary files portray the full extent of the geographic areas, including the coastal water area of Canada.
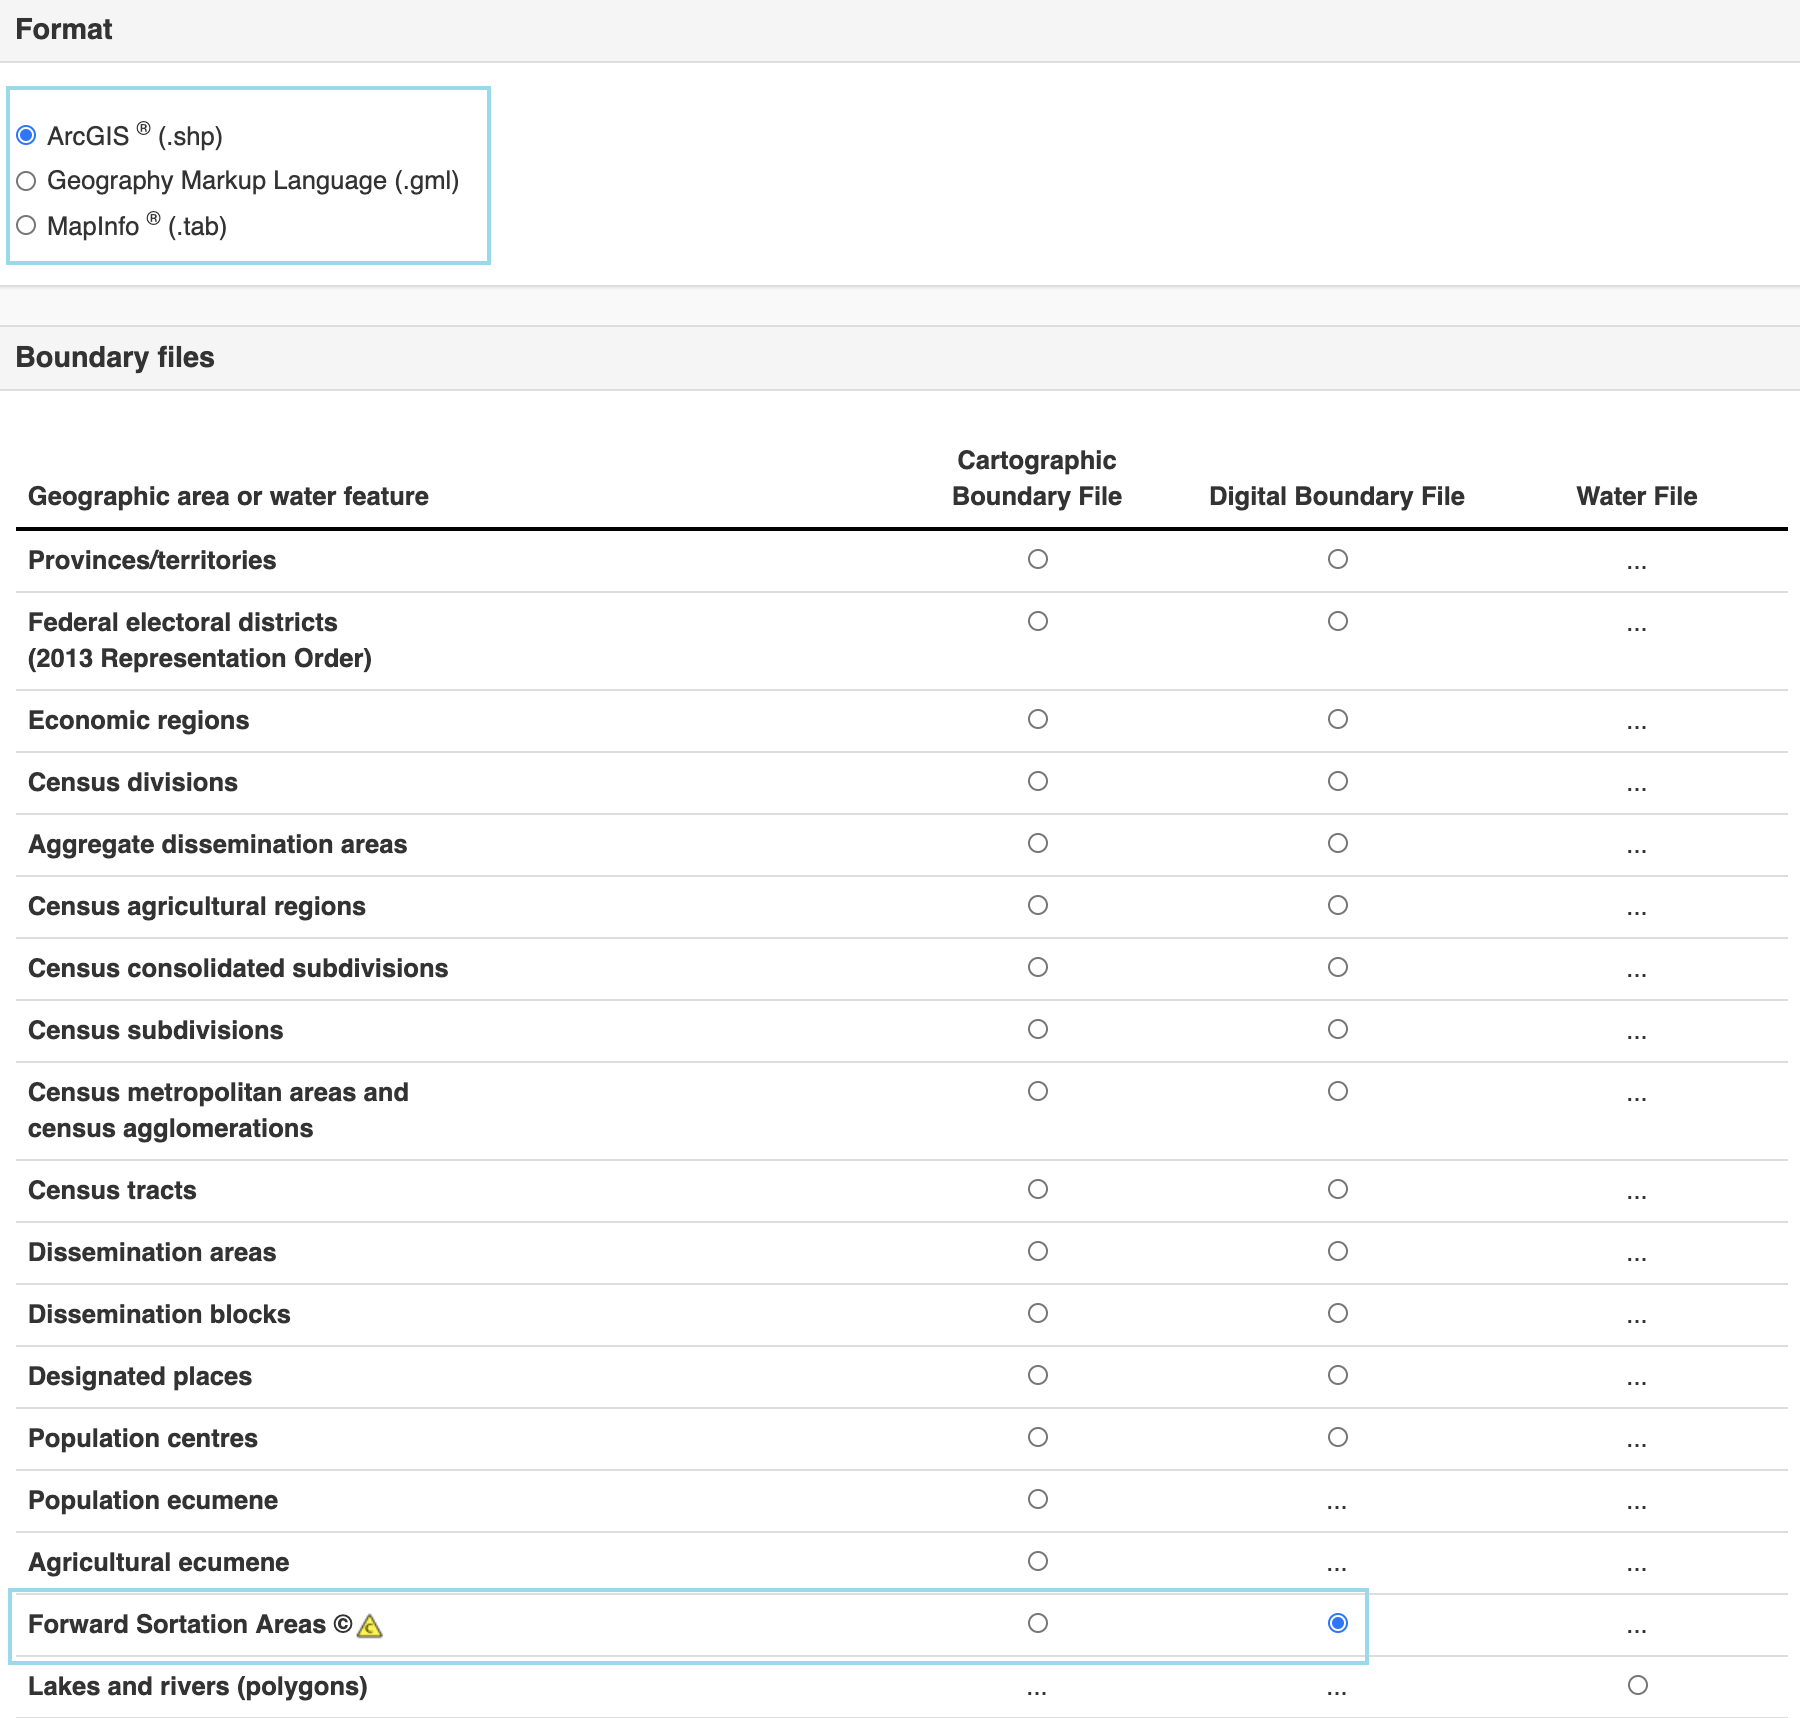
Pay attention to select right shapefile:
- format: ArcGIS ® (.shp) file
- Geographic area or water feature: Forward Sortation Area
- Digital Boundary File
1.2 Data Cleaning
Let us first import python packages.
1 | # library to handle data in a vectorized manner |
Then let us try to clean data and have postal codes of Toronto FSAs.
1 | # Read wikipedia page |
1.3 GIS software
We will need GIS software to open shapefile (.shp). Fortunately Mac user could download the QGIS software from here.QGIS is A Free and Open Source Geographic Information System. You can create, edit, visualise, analyse and publish geospatial information on Windows, Mac, Linux, BSD and mobile devices.
2. Read Shapefile
Now we have our valid postal codes list for analysis, shapefile of Canada as well as GIS software to read shapefile. Let’s try read shapefile of canada.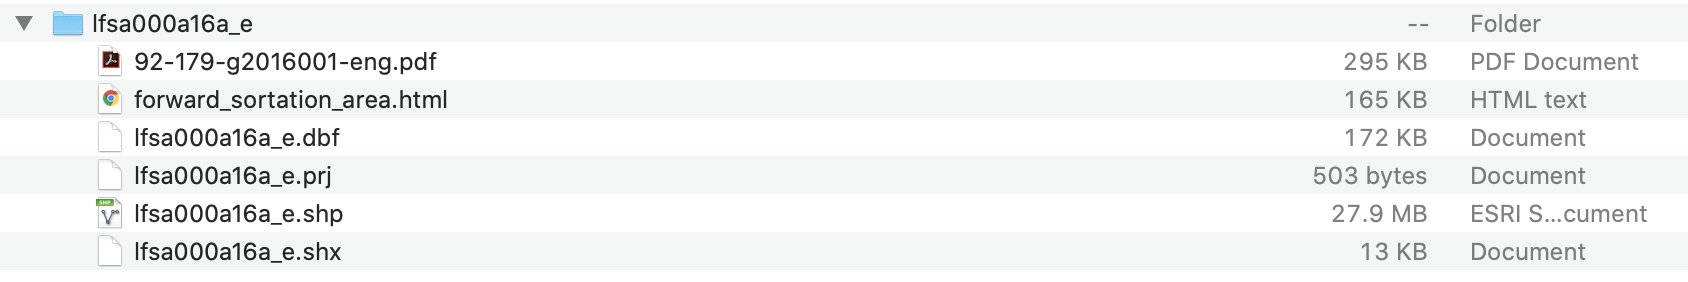
2.1 Add Layer
After open QGIS, first we have to open shapefile and add vector layer.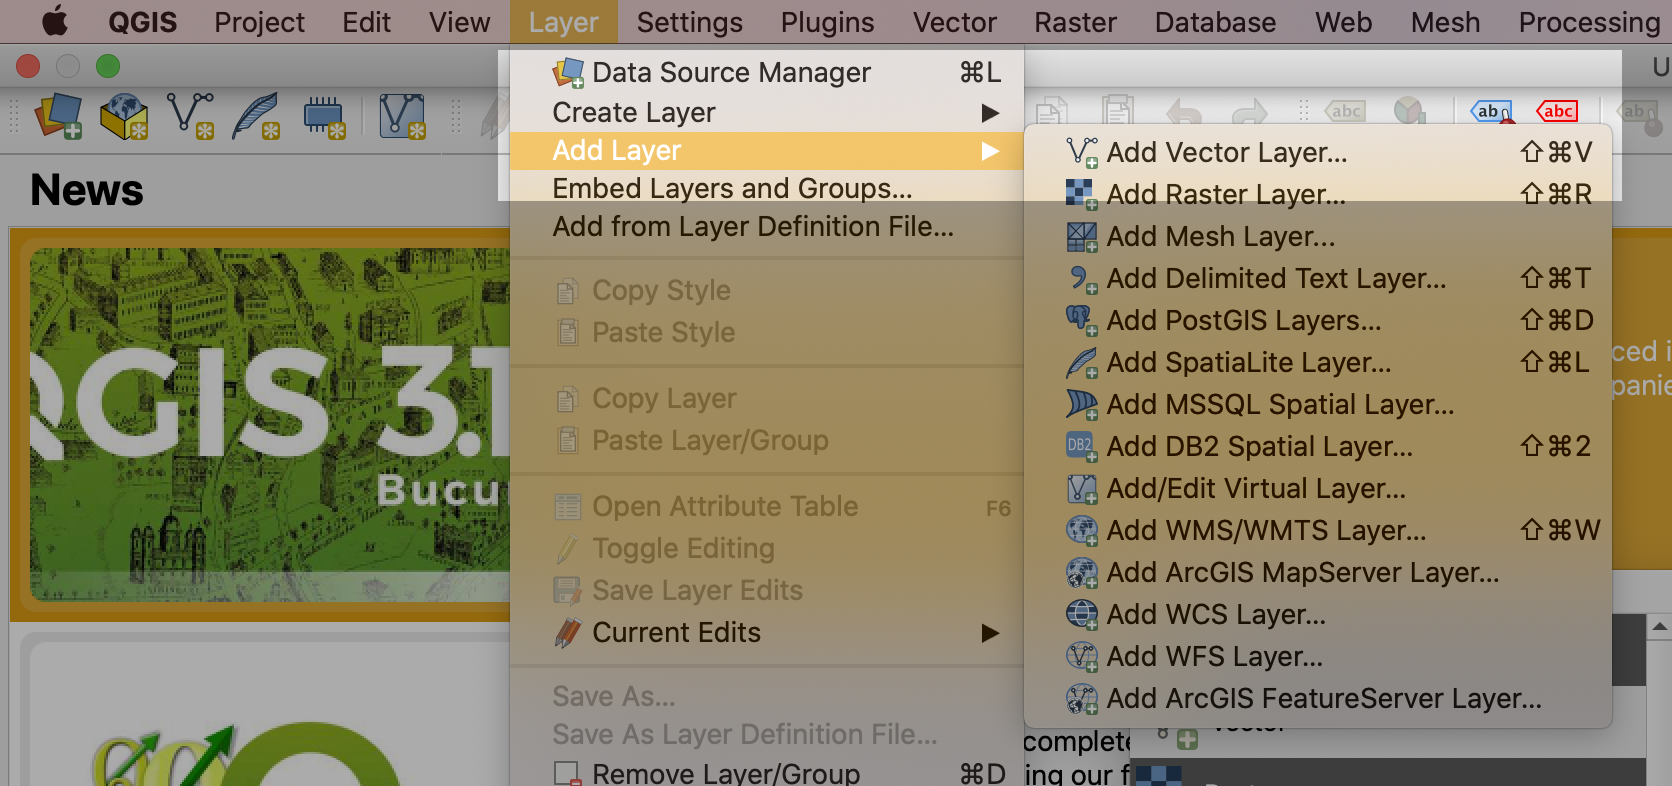
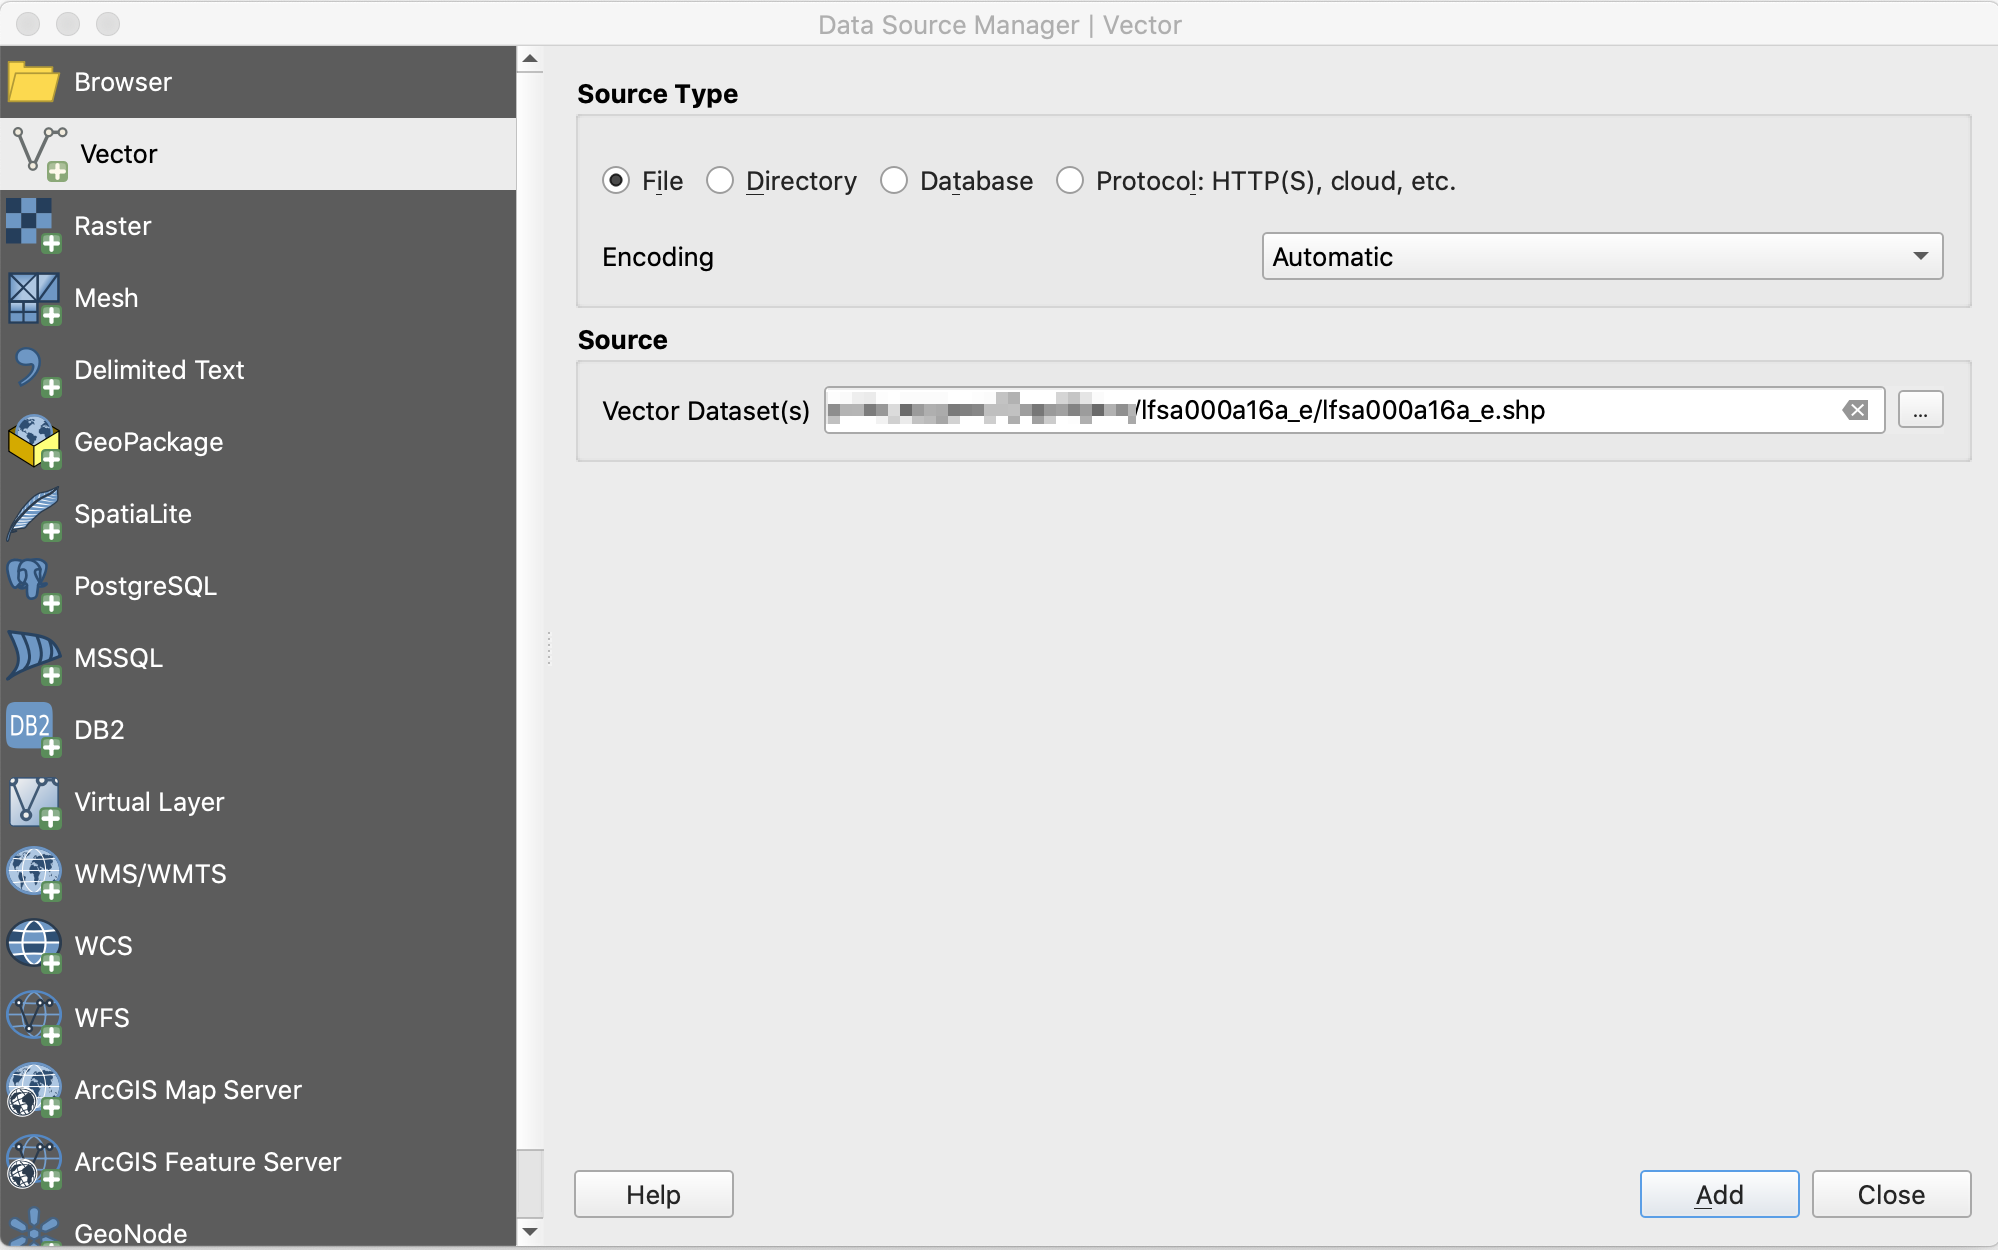
Then we could take a close look of our file.
2.2 Filter Layer
We only need Toronto’s FSAs geojson so we have to filter our layer. Again, we select Layer - Filter or we could just simply use shortcut for filter: command + f
Ok. So on query builder there are three fields on the file: “CFSAUID” “PRUID” “PRNAME”. On the Values box we can press ‘all’ to observe each field.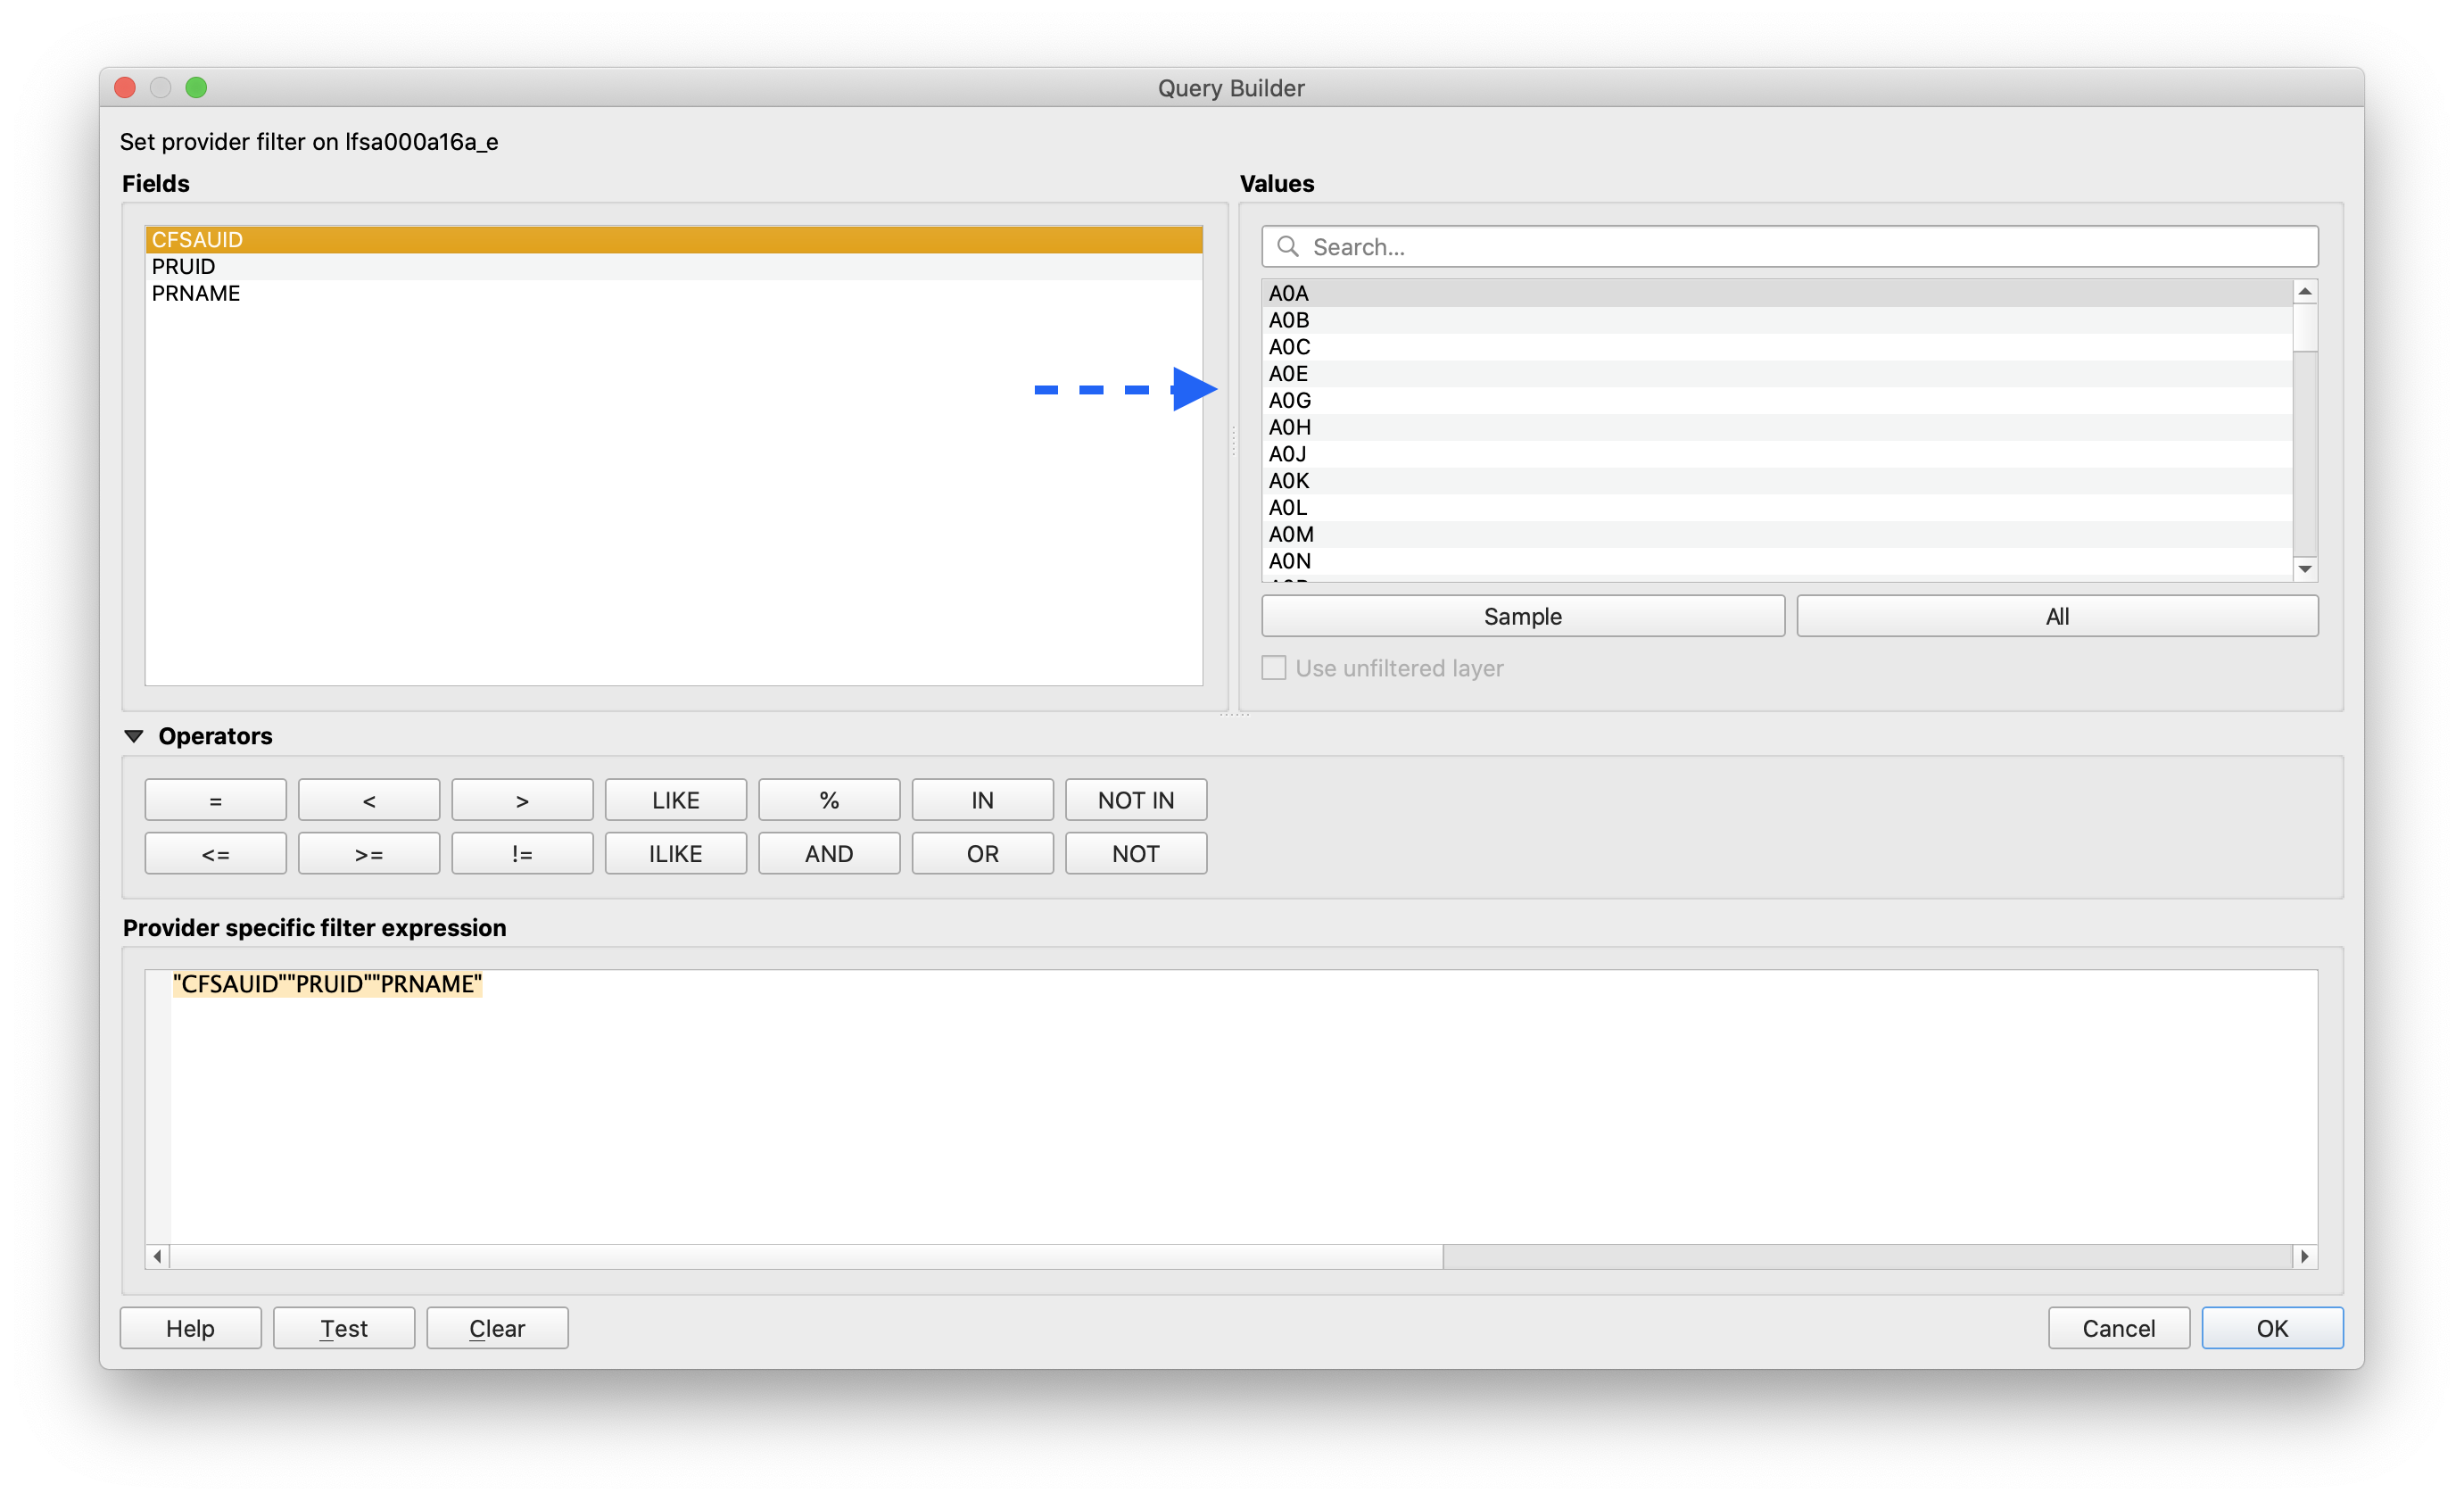
Now we could filter our layer using postal codes of Toronto. Let us provide specific filter expression
1 | "CFSAUID" IN (postal codes list)" |
Let’s test the filter to see if it is working.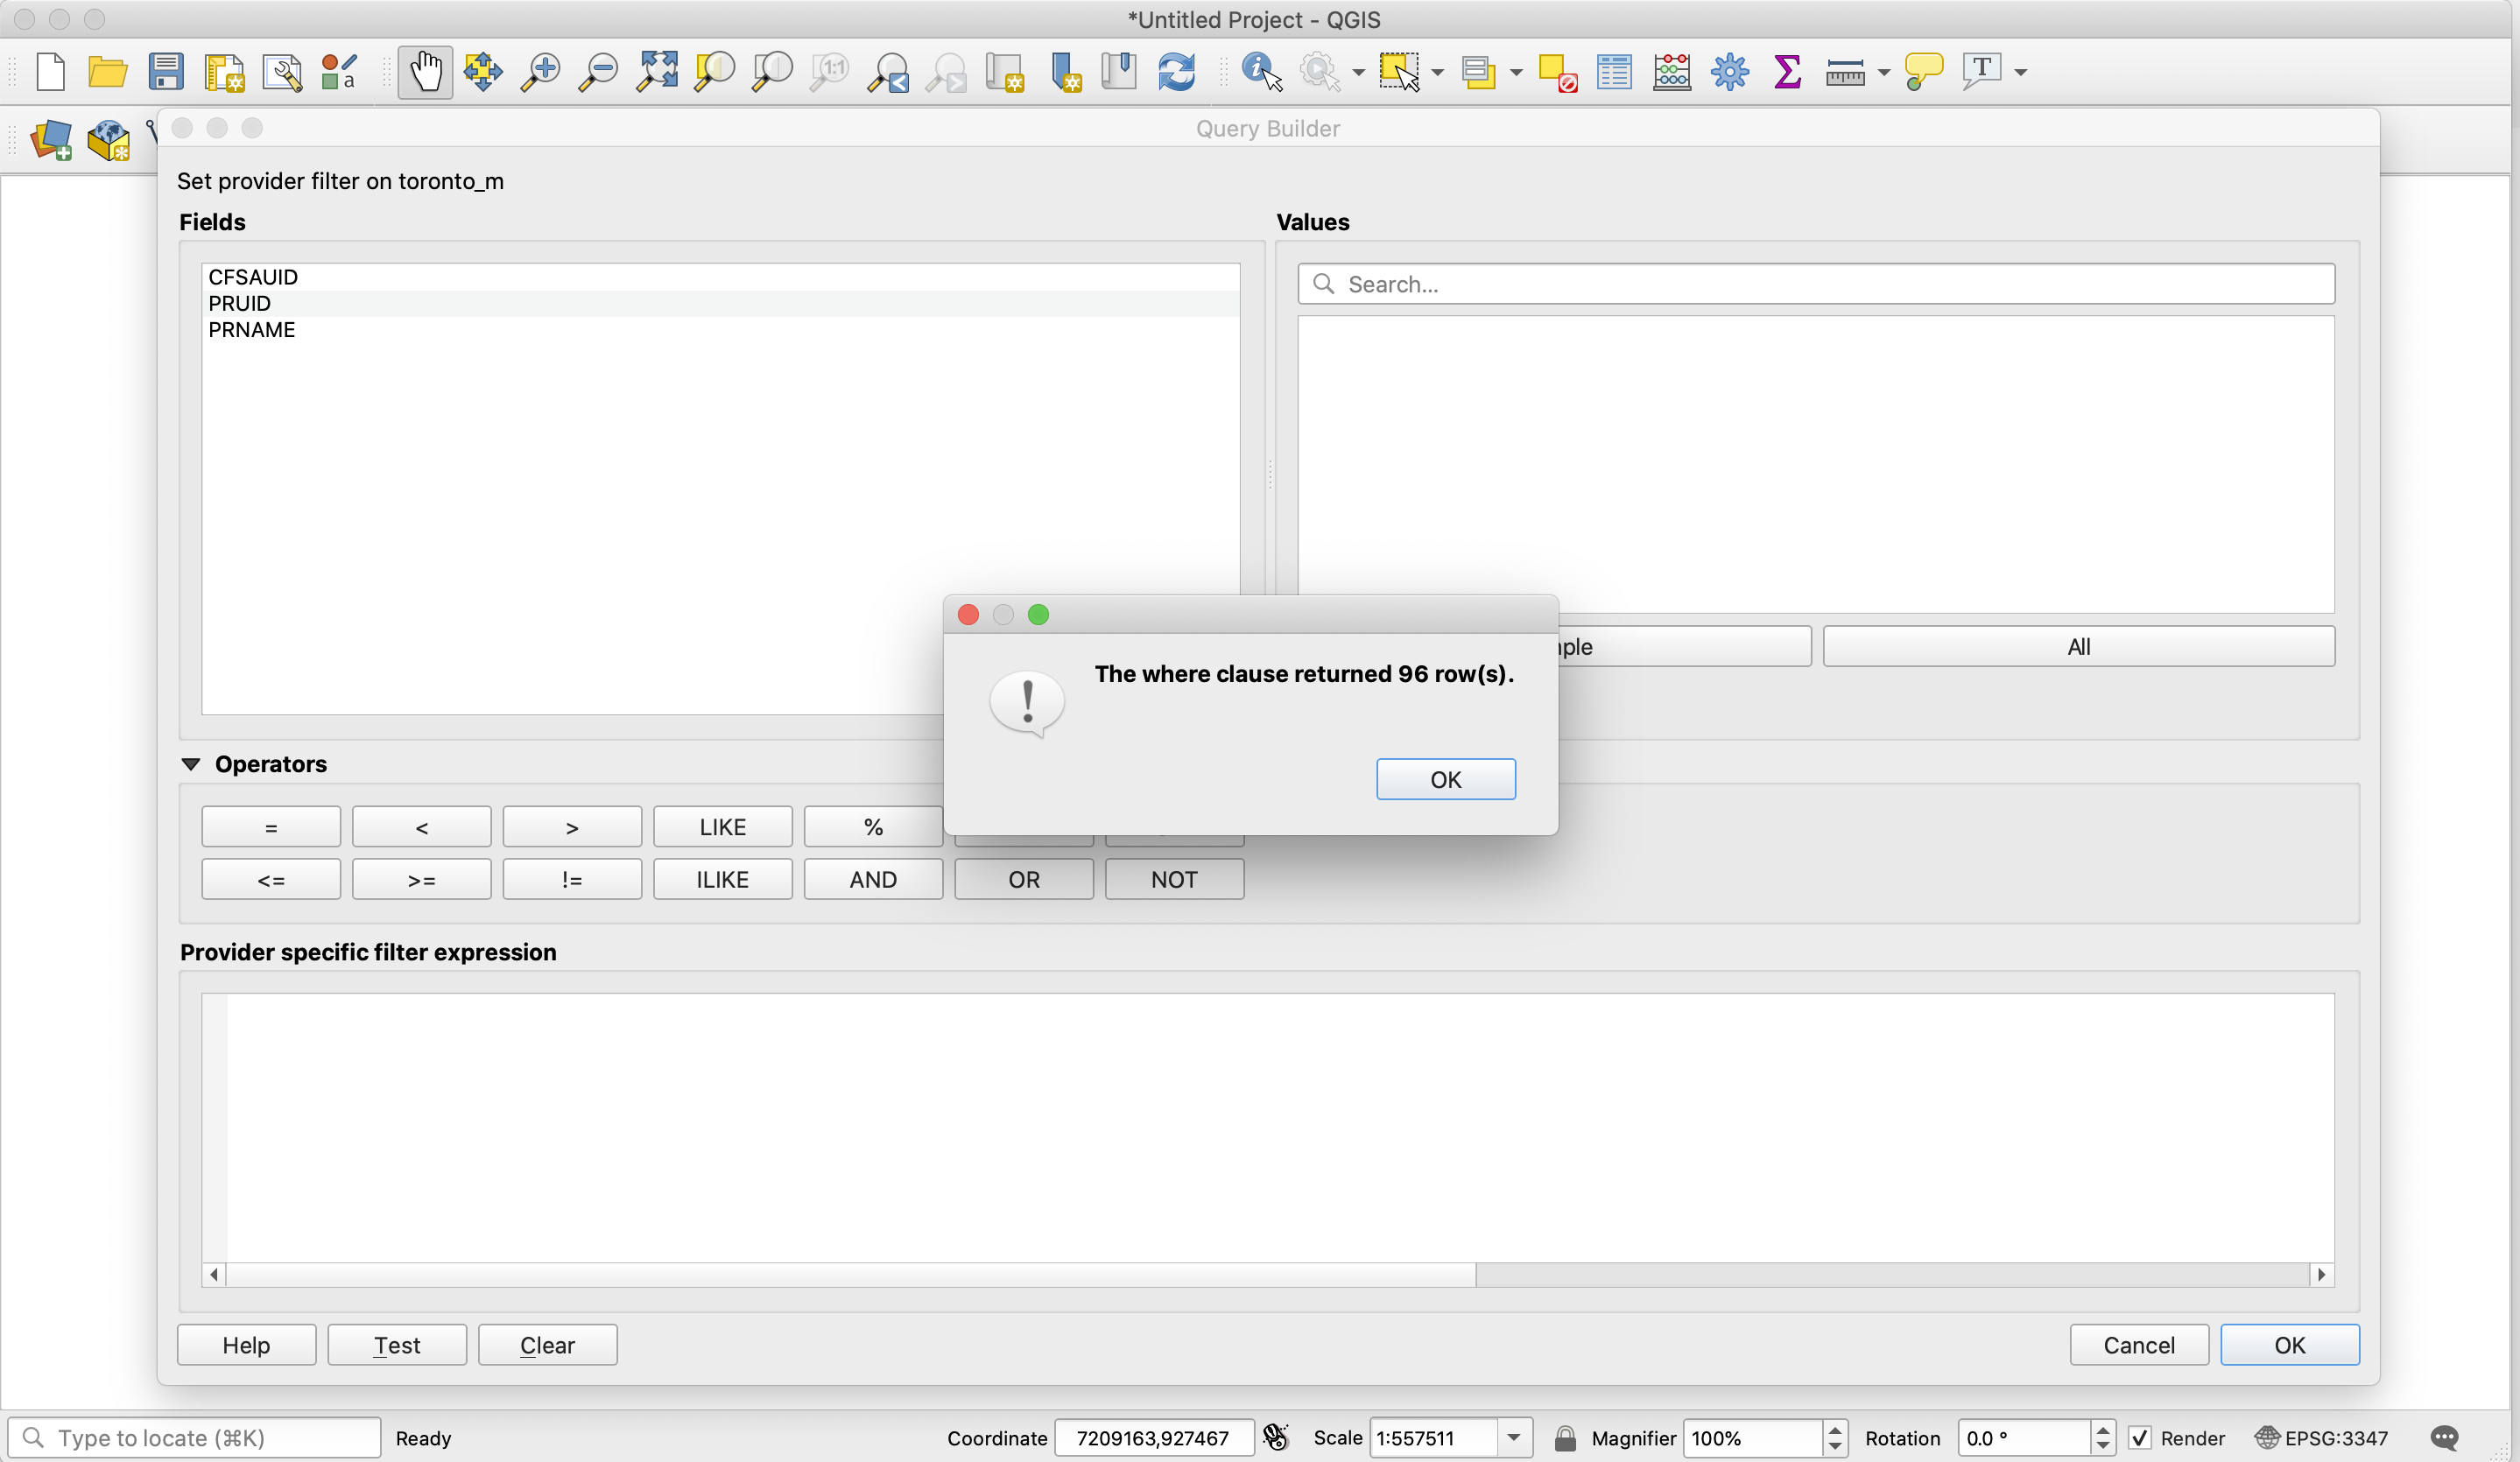
96 rows. Looks good.
2.3 Generating GeoJSON File
Now let us save this layer to GeoJSON format. Layer - Save as. Please set to format to WGS84 format since we will need folium package to create a map based on GeoJSON file.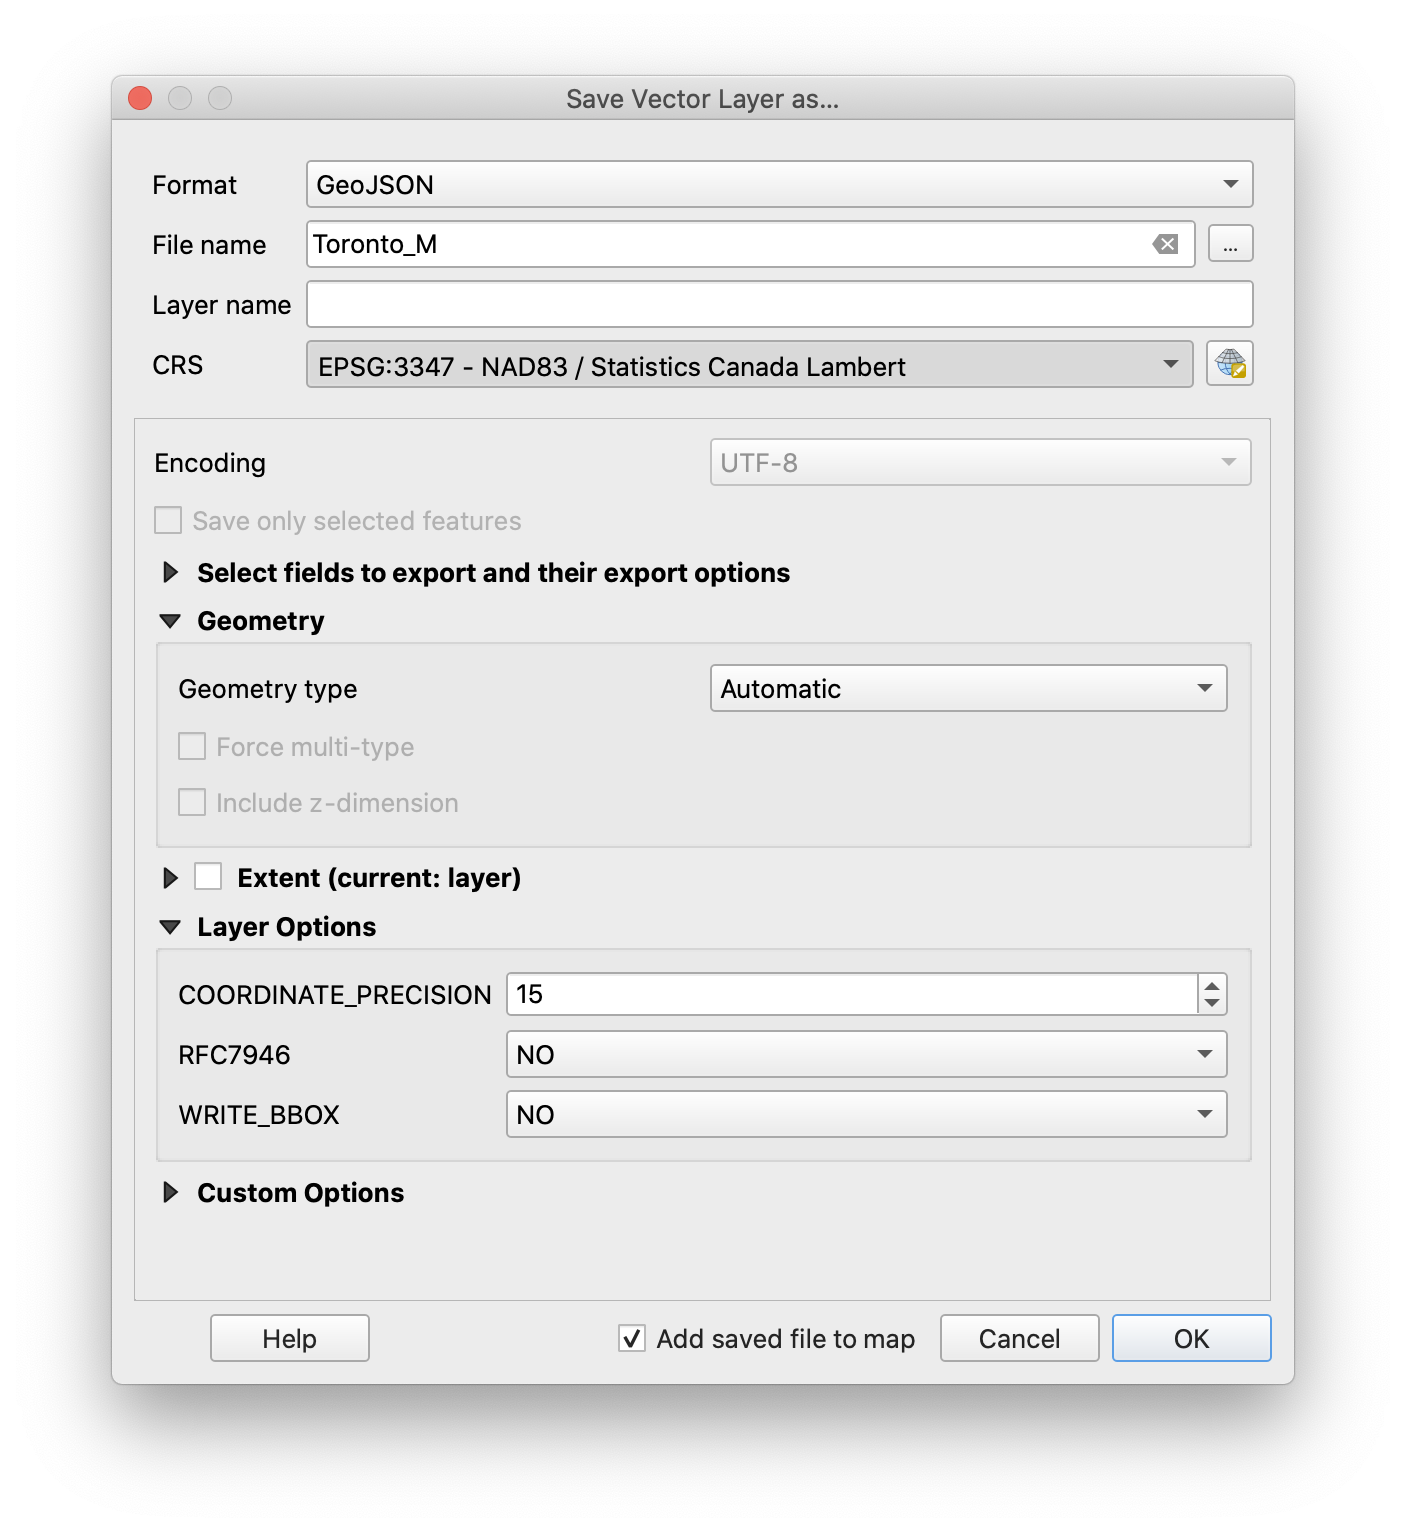
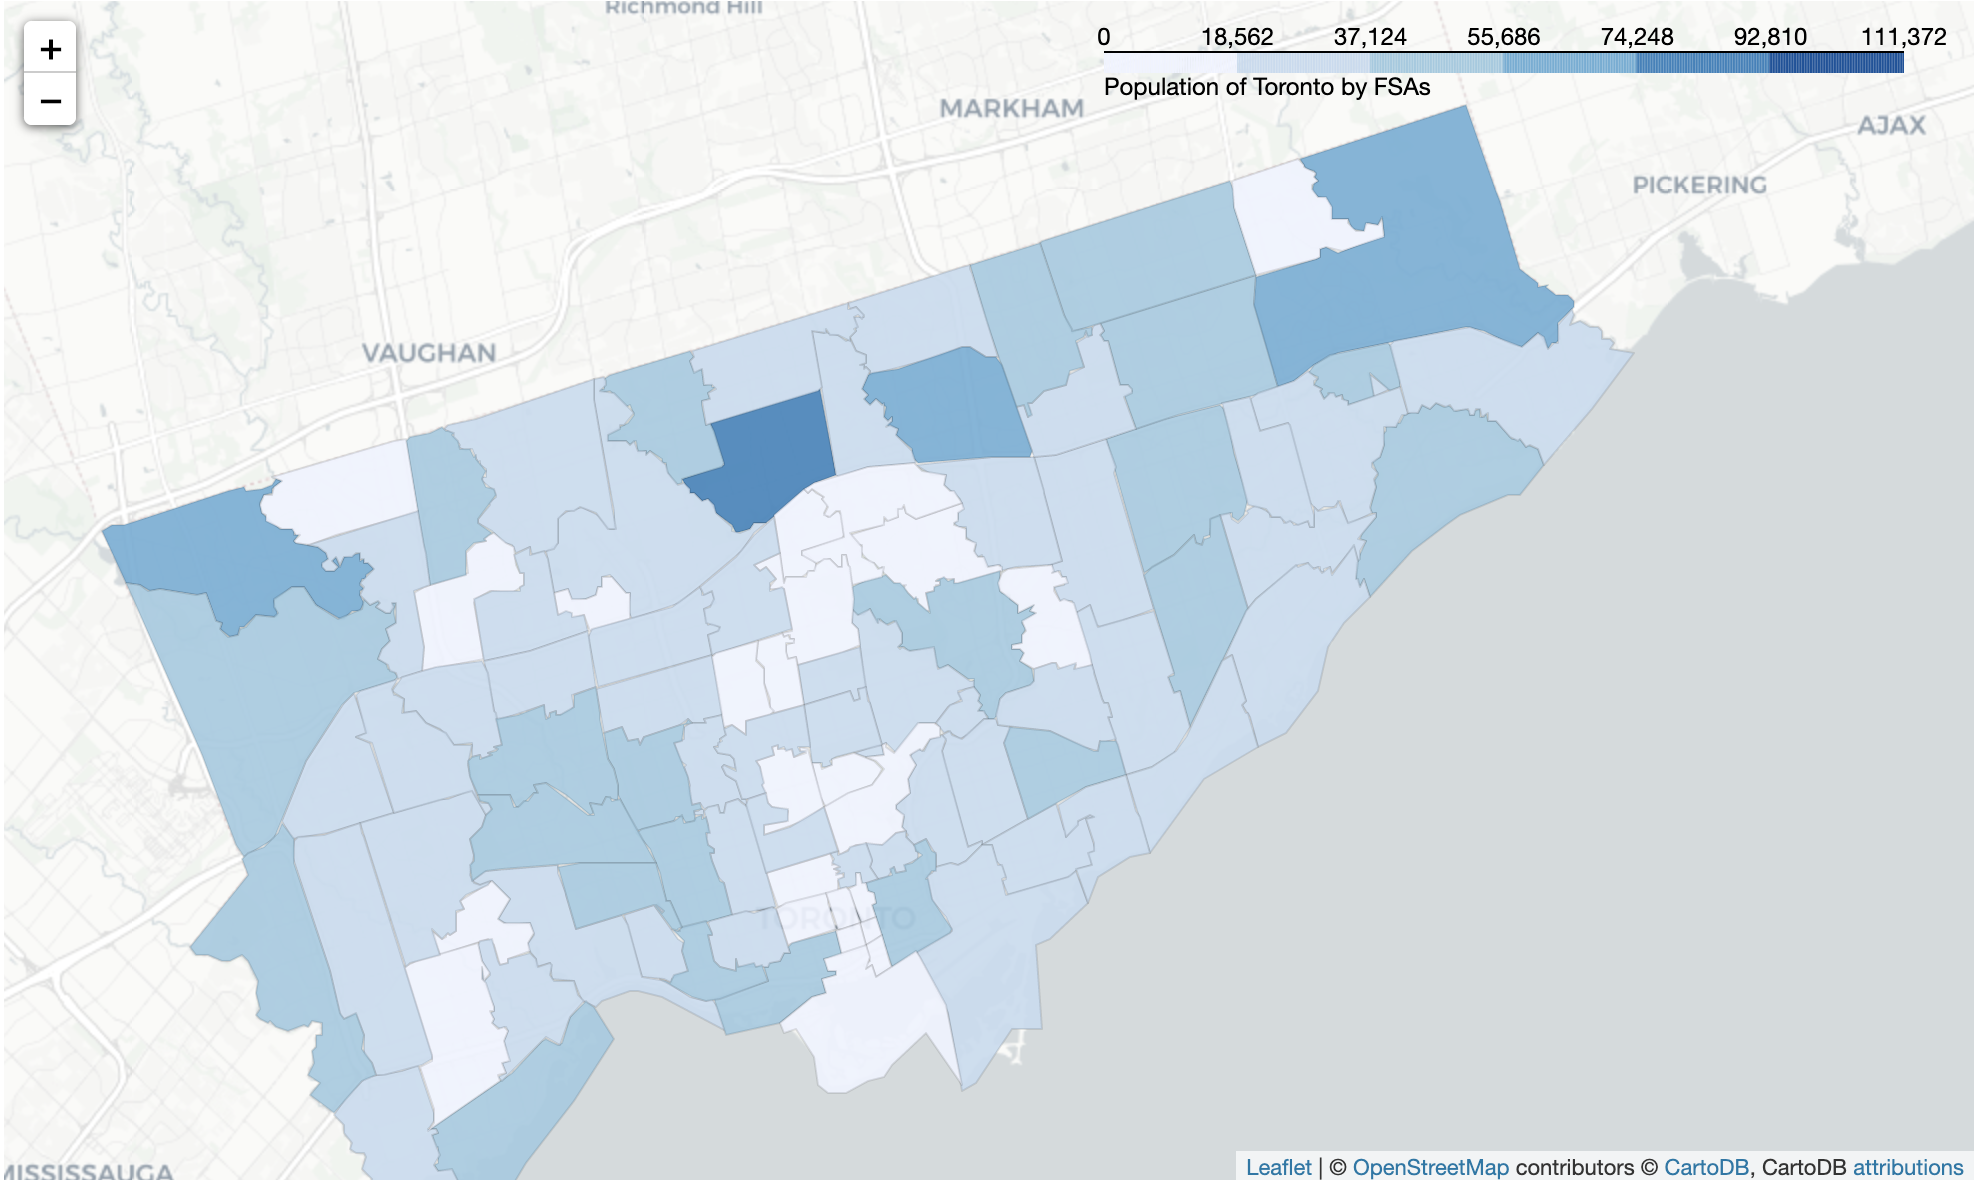
Voila. Here is out geojson file of Toronto. Let us try to create population choropleth map of Toronto. Here I uploaded the GeoJSON to Github. Feel free to download it.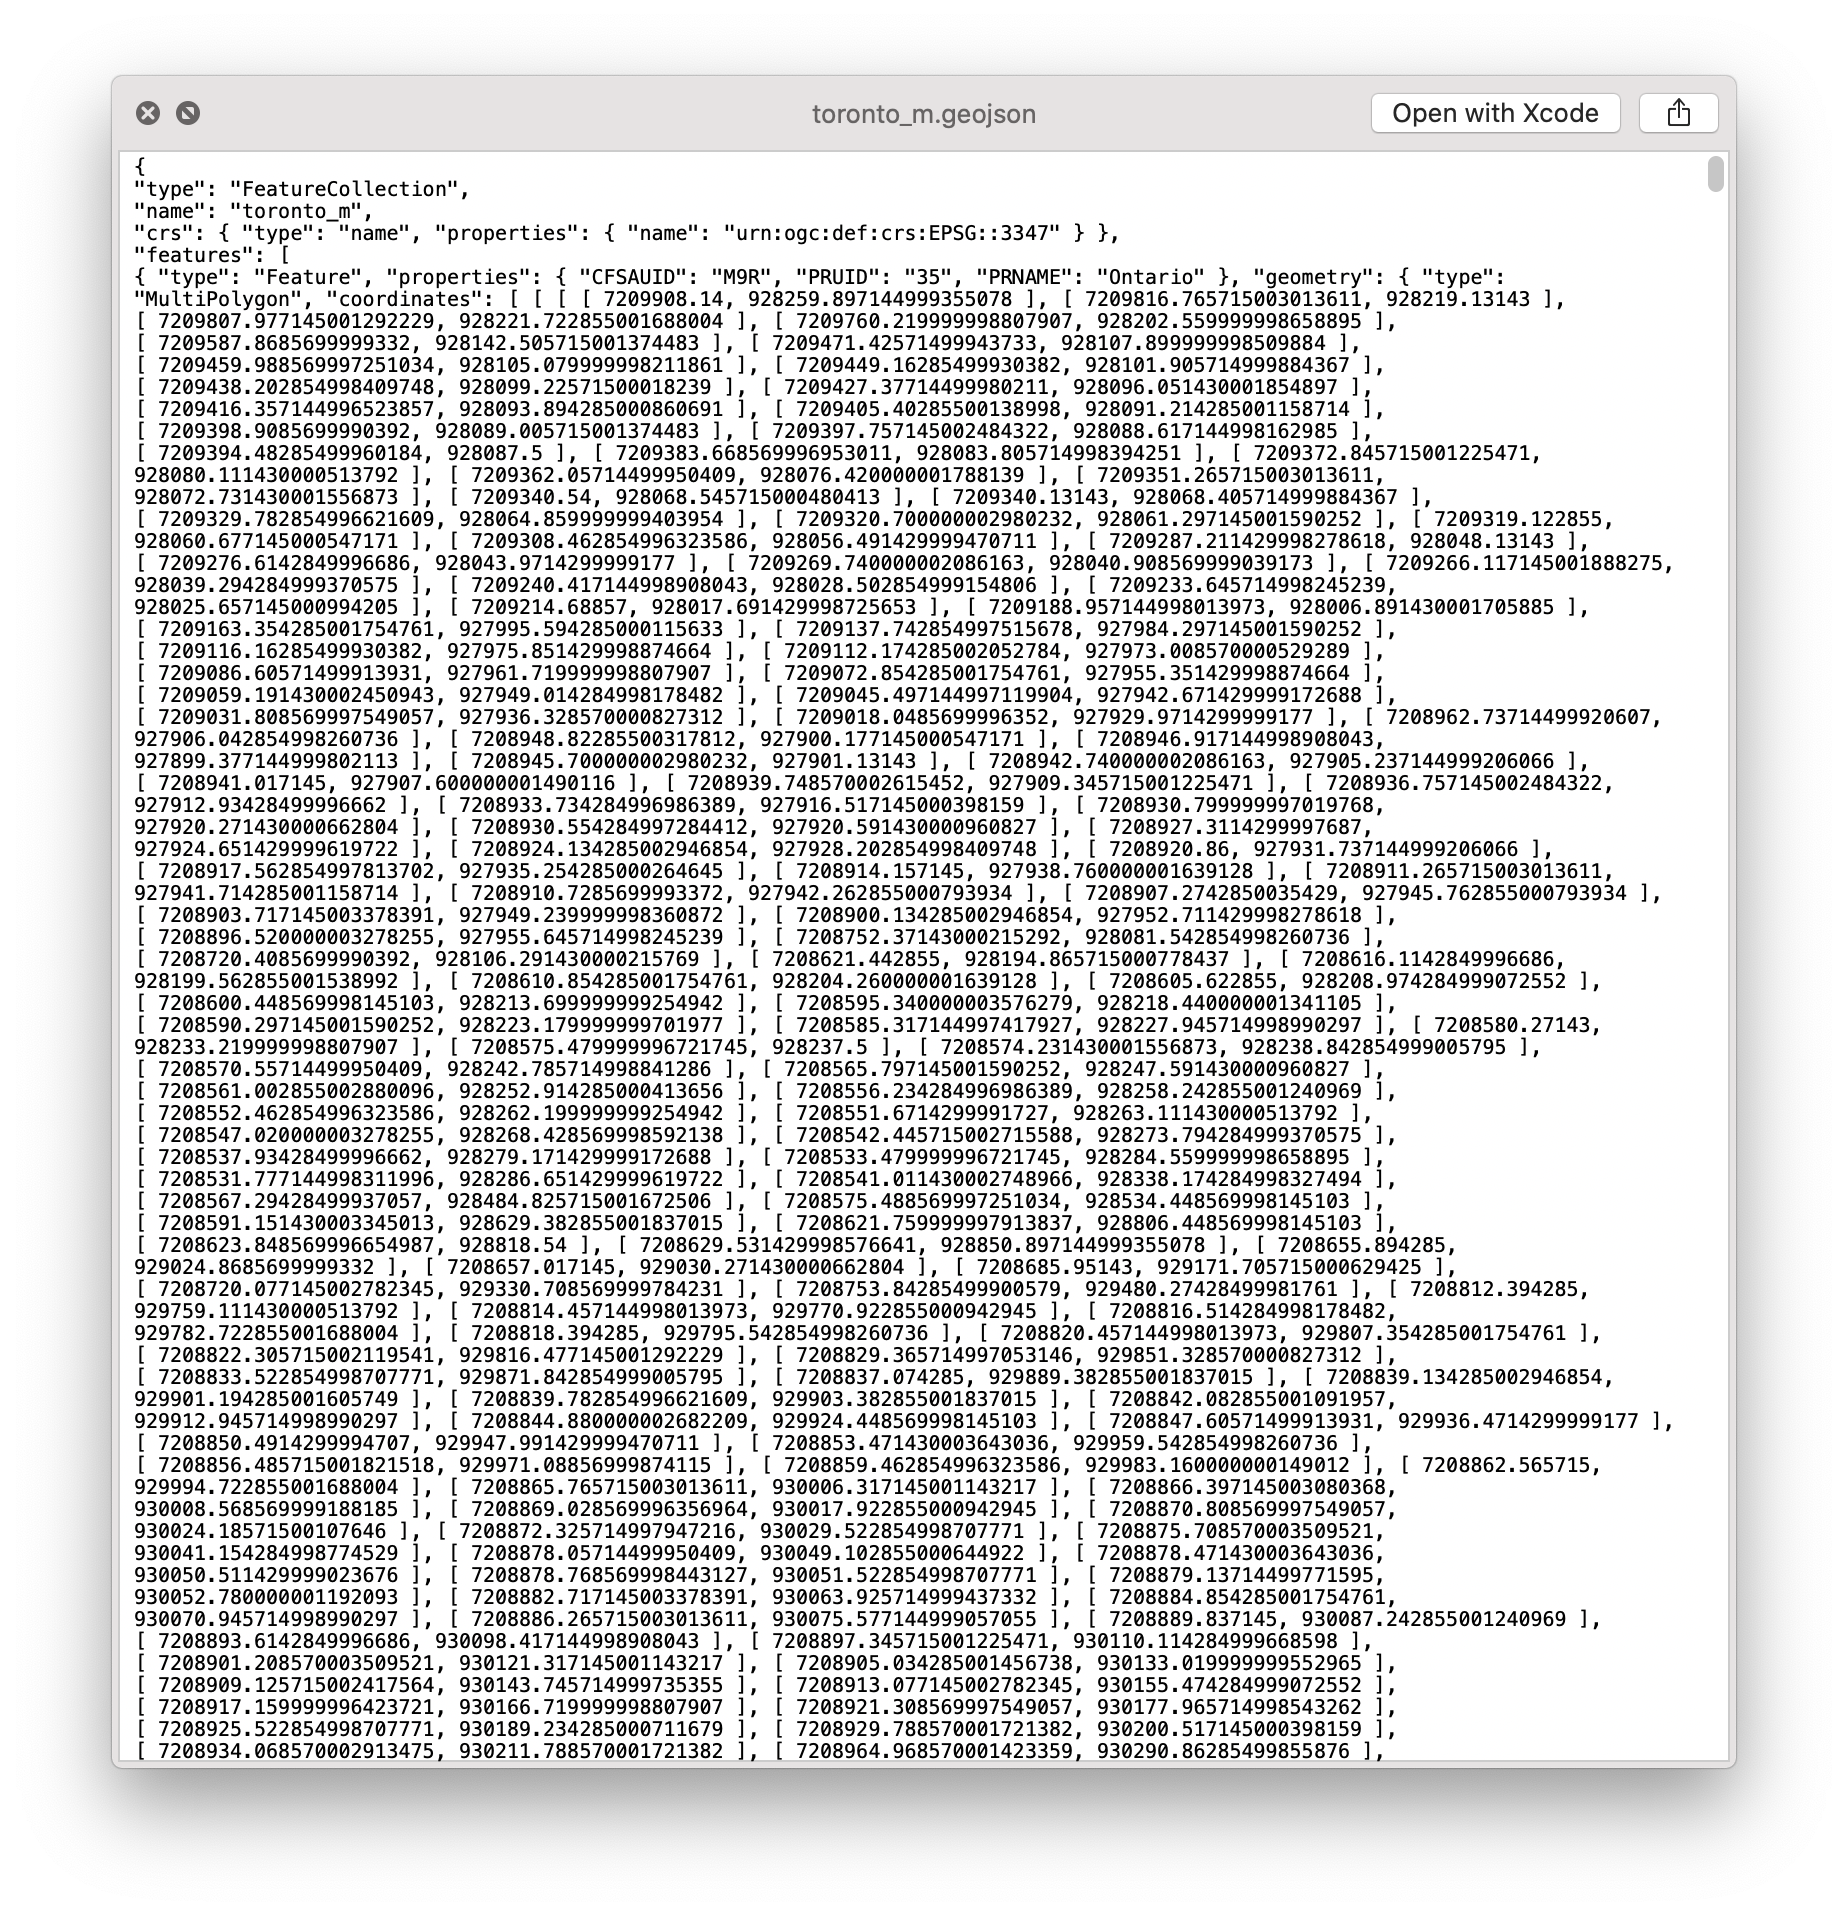
3. Choropleth Map of Toronto (Bonus Part)
3.1 Obtain Population information
Statistics Canada has provided the information based on FSAs. Let us first do some data cleaning.
1 | # fetch url |
3.2 Create population choropleth map of Toronto
Ok. We have our population data as well as geojson file. Let’s map it.
1 | # map rendering library |
Here is the map. Thank you for reading this.